How to Visualize Project Progress

What is project visualization?
In short, project visualization or visual project management combines visual tools – such as graphs and charts – with traditional project management methodologies to help project managers better understand the status and shortcomings of a project.
Visual project management helps you quickly identify tasks, priorities, and critical elements that require attention. It also lets teams see how far along a project is, what tasks remain, and which resources are being utilized. And using project management software with data visualization capabilities ensures that projects stay on track and within budget by providing an easy-to-understand overview of pending and completed work.

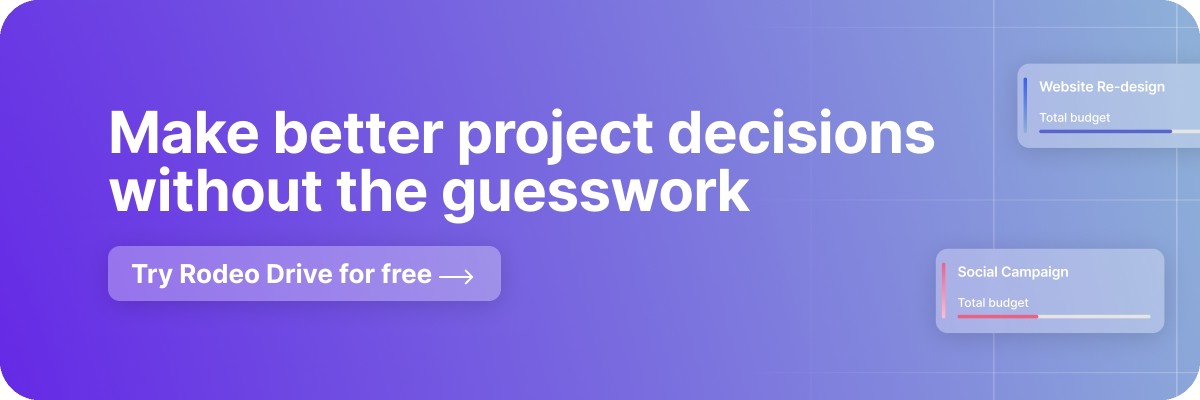
Being an all-in-one project management software, Rodeo Drive offers features that can help with project visualization, allowing you the ability to monitor the progress of tasks and spot issues before they become major problems.
Benefits of using visual project management
There are many benefits associated with using visual project management resources, including:
Birds-eye view
One of the main benefits of using project visualization or visual project management is its ability to provide a clear overview of the project.
Having a birds-eye view helps to identify key elements and their relationships with each other, as well as helping to identify and prioritize tasks. Additionally, using project visualization allows for a better understanding of the overall project timeline, budget, and process.
Effective project monitoring
Another advantage of visual project management is that it enables effective monitoring of projects from start to finish. This includes tracking milestones and overall performance metrics such as cost overruns or deadline delays. With this information readily available in graphical form, managers can make informed decisions on how to address any issues that arise.
Improved project efficiency
Finally, visualizing projects also helps improve project efficiency by highlighting areas where resources could be better utilized or processes streamlined to achieve optimum results. Project visualization can reduce a project timeline, quicken project management plans, and improve stakeholder communication.
Project visualization results
The primary goal of using visualizations when managing projects is improved decision-making. These decisions are based on accurate data analysis and insights derived from real-time monitoring.
As such, key outcomes include:
- Improved team collaboration due to increased visibility across teams working on different tasks
- Greater accuracy in estimating project timelines
- Better resource utilization
- Fewer errors due to improved oversight
- Faster problem identification and resolution
- Enhanced customer satisfaction
- Cost savings
- Reduced risk levels due to proactive issue resolution
- Higher quality end products due to improved communication between stakeholders
- And more
What about data visualization? How does that fit in?
Data visualization refers to transforming raw data into visually appealing charts or graphs to gain insight into trends or patterns. These patterns might not be immediately obvious from looking at numerical values alone.
When combined with other visuals like Gantt charts or Kanban boards, data visualization becomes even more powerful. It allows users to track their project status and anticipate future events based on past performance metrics.
A study by the Wharton School of Business found that using data visualization can shorten business meetings by 24%. Not only does utilizing evidence-based data lead to more informed decision-making, but it can also save you time.
Ultimately, combining data visualization techniques with project visualization offers an invaluable tool for any project-based team – especially the project manager.
Which type of data visualization is best to show progress in a project?
There is no single ‘best’ way to visualize a task's progress. Each method has its strengths and weaknesses and should be chosen based on project needs and company preferences. As long as a technique allows for accurate project planning and project status reports, it can be an effective visualization tool.
10 ways to visualize project management progress
It’s clear that visual project management is essential. Here are 10 ways project managers can use visualization to track project development:
1) Gantt charts
Gantt charts have been around since the early 1900s. Henry Gantt created this visual representation of project management and progress in 1910. As technology advances, Gantt charts have become an incredibly versatile tool for organizing and tracking progress.
Gantt charts provide a comprehensive view of the project timeline and a visual indication of the development or completion of individual tasks. They are most commonly displayed in a timeline view and used to help plan and track large projects.

When to use Gantt charts
If you want an easy way to view task timelines and resource allocations in one place, then a Gantt chart is very useful. They are especially helpful when planning complex projects involving multiple teams working over extended periods. This provides an efficient way to coordinate efforts between groups.
2) Kanban boards
Kanban boards are typically used in lean project management. Toyota's Taiichi Ohno developed this visual method of tracking project management in 1940. The idea behind Kanban boards is to visualize the workflow of your project by representing individual tasks with cards and columns.
Kanban boards are similar to Gantt charts but are used to track smaller projects and consist of columns that represent various project stages. When tasks are in their respective columns, their progress is visible to team members and stakeholders, which also helps increase transparency.
When to use Kanban boards
A Kanban board is great for tracking small incremental changes made during product development cycles since it offers quick visibility into where things currently stand.
3) Work Breakdown Structures
Work Breakdown Structures (WBS) are diagrams showing a project's hierarchical structure and the relationships between tasks and milestones. They can help project managers better understand dependencies and interdependencies.
WBSs allow users to break large projects up into smaller components based on deliverables required prior to reaching the ultimate goal(s). Each subcomponent contains further detail about specific project requirements, including cost estimates, resource estimates, and more.
When to use Work Breakdown Structures
WBSs offer effective insight into the complexity behind certain assignments, allowing individuals to gauge the level of effort required to complete them. This helps everyone avoid pitfalls that show up from lack of preparation. These are great for any size project.
4) Milestone charts
Milestone charts are similar to Gantt charts but are used to track individual tasks rather than the entire project. It typically includes the start date, end date, duration, and any other relevant information, such as task descriptions or dependencies. Milestone charts are great for keeping everyone up-to-date on the progress of a project since they show all major steps at once.
When to use milestone charts
Milestone charts are best used when there are multiple related tasks with distinct beginning and end points that need to be tracked. They also work well if your team needs to quickly get an overview of the entire project without getting bogged down in small details.
Finally, milestone charts are also helpful for tracking long-term goals and objectives since they allow you to see how far along each step is relative to others in the process. This makes them ideal for presenting high-level summaries.
5) Finish-start diagrams
Finish-start diagrams are similar to flowcharts but more focused on showing relationships between tasks rather than processes themselves. These diagrams usually consist of boxes representing different tasks connected by arrows indicating which one must precede another before it can begin (i.e., “finish/start”). Finish-start diagrams help teams identify potential problems early on by clarifying dependencies so that resources can be allocated or changes made if necessary.
When to use finish-start diagrams
Finish-start diagrams are most useful when there are interdependent tasks involved in a project because they clearly illustrate what needs to happen first. This makes it easier for teams to plan out their workflow and avoid bottlenecks due to miscommunication or lack of resources. Additionally, these diagrams help ensure that no steps fall through the cracks since every task has its own place in the diagram.
6) Network diagrams
Network diagrams use nodes (or circles) connected by lines (or arrows) called arcs to represent activities within a project as well as their respective durations, costs, and more. This allows project managers to visualize what needs to be completed and how much time/money each activity requires.
Network diagrams offer excellent visibility into resource allocation while helping teams identify areas where improvements could be made by rearranging existing tasks according to priority.
When to use network diagrams
Network diagrams should be used whenever there is a need for detailed insight into resource utilization across various stages of a project. They allow project managers to understand how to best allocate the personnel and materials needed to complete project components.
Additionally, network diagrams serve as an invaluable planning tool when preparing proposals for budgeting. Knowing exactly what goes into completing particular activities ahead of time helps create accurate cost estimates.
7) Resource utilization maps
Resource utilization maps are a project management tool that shows which resources are available, how resources are being utilized, and where there are redundancies. They allow teams to quickly see which resources have been allocated where and in what capacity they’re working during any given time.
This gives a clear view of how each resource contributes to the workload and shines a light on whether one area needs more or less attention than others. With this knowledge, project managers can determine which resources they need to go where and how they can be used effectively.
When to use resource utilization maps
Resource utilization maps are best suited for large-scale projects that involve multiple resources spread out over many milestones or phases. By tracking these resources closely, teams can better manage their workloads and avoid bottlenecks.
These visuals also give stakeholders an easy way to view overall project performance without digging into a mountain of data, helping them make informed decisions about future strategies.
8) Task lists
Task lists provide an organized breakdown of every step required to successfully complete a specific task within a larger project scope. They usually consist of individual action items listed in order from beginning to end with details such as:
- Estimated duration per item
- Who is responsible
- And more

Task lists are a great reminder for teams when tackling complex projects since they clearly outline what needs doing next without requiring users to remember everything themselves. Additionally, task lists offer visibility into what has already been done and what needs attention, allowing project managers to accurately monitor progress.
When to use task lists
Task lists are ideal for smaller-scale projects that require detailed planning before execution begins. As mentioned, they provide clear guidance on what needs to be done, plus helpful information about who’s involved. This ensures nothing gets overlooked during the implementation phase.
Additionally, task lists can easily be shared among colleagues, providing even greater transparency into current process status updates no matter where team members are. These may not be the best option for large-scale organizations whose projects have many moving pieces.
9) Project timelines
A project timeline gives an overview of when events will occur over a given period – for example, when specific milestones should be reached. They do this by showing key dates associated with various project tasks.
This makes them great for updating everyone about significant developments throughout a project's life cycle. This type of visual project management and tracking can also make it easier to see when a project is falling behind a deadline so changes can be made. Creating timelines is much easier when you have the help of visual project management software.

When to use project timelines
Timelines work well for any sized project or event. With insight into deadlines and expected timelines, you can stay on track. Not only this but when questions come up regarding already completed points in the project timeline, you can easily look back and reference when that task was completed and how.
10) Project calendars
Project calendars combine both scheduling elements found within typical timeline visuals with extra information concerning scheduled tasks. This allows project managers to observe general activity and drill deeper. Specifics pertaining to tasks might include details such as:
- Assigned personnel
- Expected deliverables and assets
- Timeline
- And more

When to use project calendars
Project calendars are perfect for situations where large-scale coordination is necessary. This is because it gives each team a clear view of when certain parts of the project are timed to be completed and what goes into that task.
Visualizing project progress can be a great way to stay on track and ensure your project is completed efficiently and effectively. Using various tools, such as Gantt charts, Kanban boards, or resource utilization maps, you can easily visualize how much work has been done, what tasks still need to be accomplished, and more.
Visualizing your project status also helps team members collaborate effectively so that everyone involved knows exactly where they are and what needs to be done.
Discover more project management tips and strategies with Rodeo Drive
Rodeo Drive is an all-in-one software solution designed to help businesses manage their projects more efficiently. The project management tool incorporates time tracking, smarter planning, cleaner budgets, and streamlined invoicing all in one place – eliminating the need for integrations.
Rodeo Drive allows you to plan a task while in timeline view, which makes it easier than ever to keep your team's capacity in check. If a task needs to be rescheduled, simply drag and drop it to a new day. Plus, Rodeo Drive's "Reports" tab will give you insights into how employees are using their time and how profitable each project is.

Our tool supports your projects at every stage of their lifecycle so you always know exactly where your team stands. Rodeo Drive’s intuitive interface also makes it simple to use and easy to onboard new employees.
Schedule a demo to see how Rodeo Drive can help your team better visualize your progress to make data-driven decisions, or try for free today.