12 Project Management KPIs to Better Gauge Team Performance
Project managers already understand the importance of tracking project performance, but determining how to best do so is a whole different story.
This is where Key Performance Indicators (KPIs) come in. Project KPIs help project managers monitor overall performance, ensuring their team is sticking to the project schedule and budget. KPIs serve as a built-in way to measure this progress in a structured format.
If you want to learn more about using KPIs in project management, you’re in the right place. In this blog, we’ll help you understand the different types of Key Performance Indicators, the benefits of using them, and suggest a dozen project KPIs to implement during your next project.
What are KPIs?
KPI stands for “Key Performance Indicator,” which serves as a way to quantify your team’s performance toward long-term goals and objectives.
Typically, you’d set your KPIs at the beginning of a project or campaign and monitor them at certain points throughout all phases of a project life cycle to better understand if your progress is at the level it should be.
On an organizational level, KPIs can also be used to measure how well your company measures up against competitors or industry standards. Regardless of how they’re used, KPIs help teams turn their project performance data into actionable insights.

Types of project management KPIs
While any business might find KPIs beneficial, project managers often find they’re a useful tool for keeping projects within their expected timeline, budget, and scope.
The stakes are high in many projects, which is why monitoring progress is all the more important. You don’t want any surprises late in the project process.
That said, not all project KPIs are created equal. In fact, KPIs can monitor a variety of factors, ranging from the strength of your processes to the quality of your team’s outputs. Here’s a look at the main types of project management KPIs:
Quantitative KPI
Quantitative KPIs are numbers based and directly measurable. Most KPIs fall into this category, including financial metrics like earned value, actual costs, or average cost per hour.
Need a better way of visually representing your quantitative KPI data? Take a look at our list of the top 12 most useful project management charts.
Qualitative KPI
Qualitative KPIs are descriptive rather than numerical, meaning they aren’t measurable in the same way that quantitative KPIs are. As a result, qualitative project KPIs might be more feedback based. This might include checking that focus group feedback is positive about a new product before moving to the next stage of a project.
Process KPI
Process KPIs are centered around measuring the efficiency of a particular business or project process. For example, a KPI on the number of budget iterations a project has would fall here, as that KPI monitors the thoroughness of a process in the planning phase.
Looking for ways to improve workplace efficiency? Check out these 10 proven strategies that actually work.
Input KPI
This type of Key Performance Indicator focuses on the number of resources your project team is given to generate results. KPIs related to spending on materials or employee training can be considered input KPIs.
Output KPI
As you might’ve guessed, output KPIs measure the results of business activities. From a project perspective, output KPIs might be most important, as they monitor what your team has produced at various points in the project process.
This might include KPIs like the percentage of tasks completed or the on-time completion percentage of your project activities.
Leading KPI
A leading KPI is one that monitors activities that significantly contribute to your team’s future performance. So, for instance, if your main project objective is to release a new product offering, KPIs measuring progress toward building new product features, for example, would be leading KPIs.
Here are 10 ways how to visualize project progress.
Lagging KPI
Whereas leading KPIs help your team prepare for future performance, lagging KPIs reflect whether a past performance was a success. This includes KPIs you’d examine at the end of a project, like final ROI or employee churn rate.
Because lagging KPIs are examined after the fact, they might help improve performance for future projects, but they’re not actionable as far as your current project is concerned.
Why use KPIs?
KPIs are extremely helpful in monitoring the efficacy of your project processes. Because most project management KPIs are quantitative — meaning they rely on data to track your project performance — they’re an objective measure of how well your team is progressing.
Plus, if scope changes are made at any point during the project lifecycle, KPIs are built-in assurance that those changes are appropriately monitored. If your team made a wrong turn, this makes it easy to identify issues early on and course correct quickly.
Related: Don't Let Scope Creep Ruin Your Project: Tips and Best Practices
KPIs vs. OKRs and other goal-setting frameworks
There’s often a lot of confusion surrounding whether KPIs count as a goal-setting framework. But in fact, they aren’t.
Rather, KPIs function as standalone metrics for tracking project performance, which means they aren’t used as a way to set goals. Measurement is the key purpose of KPIs, whereas Objectives and Key Results (OKRs) are used to help teams set new goals and push them forward.
For this reason, KPIs and OKRs have different use cases. OKRs are great for pushing your team in a new direction since they’re focused on stretch goals. Conversely, KPIs are a solid option for monitoring a project that’s following a plan that’s already been tried and tested.
12 project management KPIs to implement in your next project
When setting project KPIs, it’s imperative that you consider which factors are most important for your project’s success. For example, if resource allocation is a top concern, then you might want to monitor KPIs like resource utilization and actual costs.
Bottom line, there’s no point in setting up KPIs that won’t be useful for your team. Your KPIs should yield insights that can help your team better understand how they can course correct to make the project a success.
You might be wondering what a typical project KPI looks like or what the most common KPIs are for project teams. Below, we’ll take a look at a dozen KPIs you’ll want to consider monitoring.
1. Return on investment
Keeping your projects profitable is key to the long-term success of your agency. Return on investment, also known as ROI, is a great KPI to monitor and measure profit on the projects you’re taking on.
To calculate ROI, you’ll need to subtract your actual costs from your project’s earned value. If the value of your work is higher than the amount you put in, that means your project is profitable.
While ROI is most important at the end of a project, that doesn’t mean this can’t be a project KPI that you monitor along the way. Checking your ROI at the end of each project phase is one way to monitor your profitability and quickly make adjustments if a project is costing way more than it should be.

2. Actual costs
Your actual costs are just the total amount of money you’ve spent on project activities. This includes the cost of your team’s time, as well as any expenses your team has incurred on behalf of your client.
Ideally, your actual costs will be lower than your earned value to ensure a profitable project outcome. However, sometimes bumps in the road can cause teams to overspend.
This is why it’s so important to set an actual cost KPI, that way you won’t forget to monitor your spending along the way. Should you identify an unforeseen spike in spending, you can readjust your budget for the next phase accordingly to help rectify the situation.
If your team struggles to keep your actual costs under control, a project management software solution like Rodeo Drive can help.
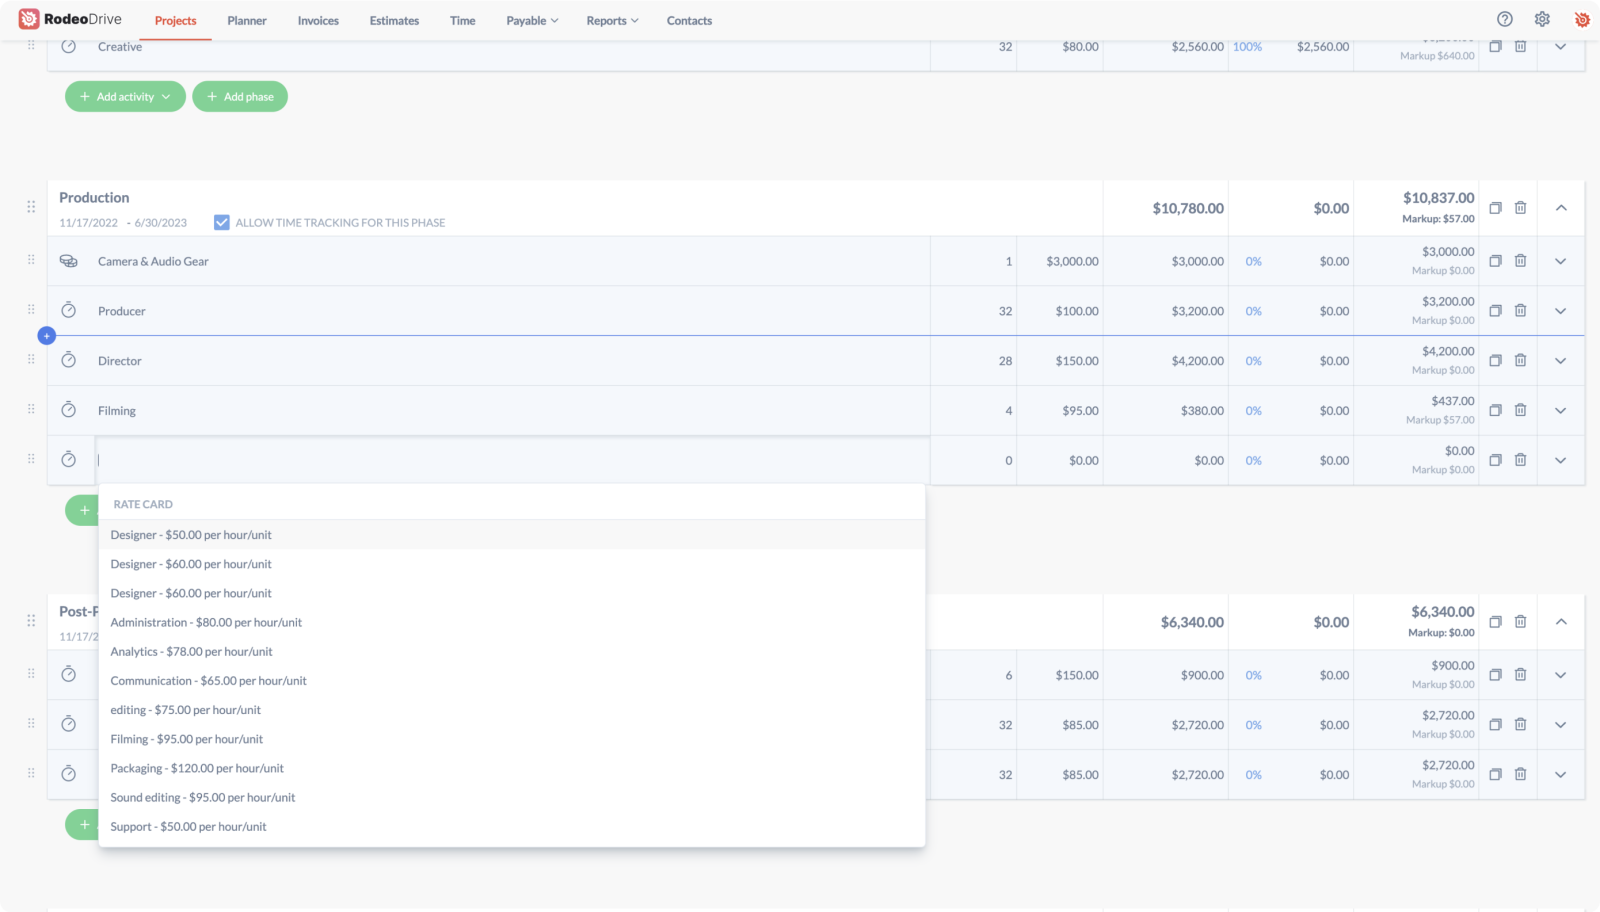
All projects begin with setting a budget in Rodeo Drive, which gives you a clear picture of what your team can spend during each project phase. Once that budget is approved by your client, your team can track their time in Rodeo Drive as they work, which then automatically updates your budget in real time.
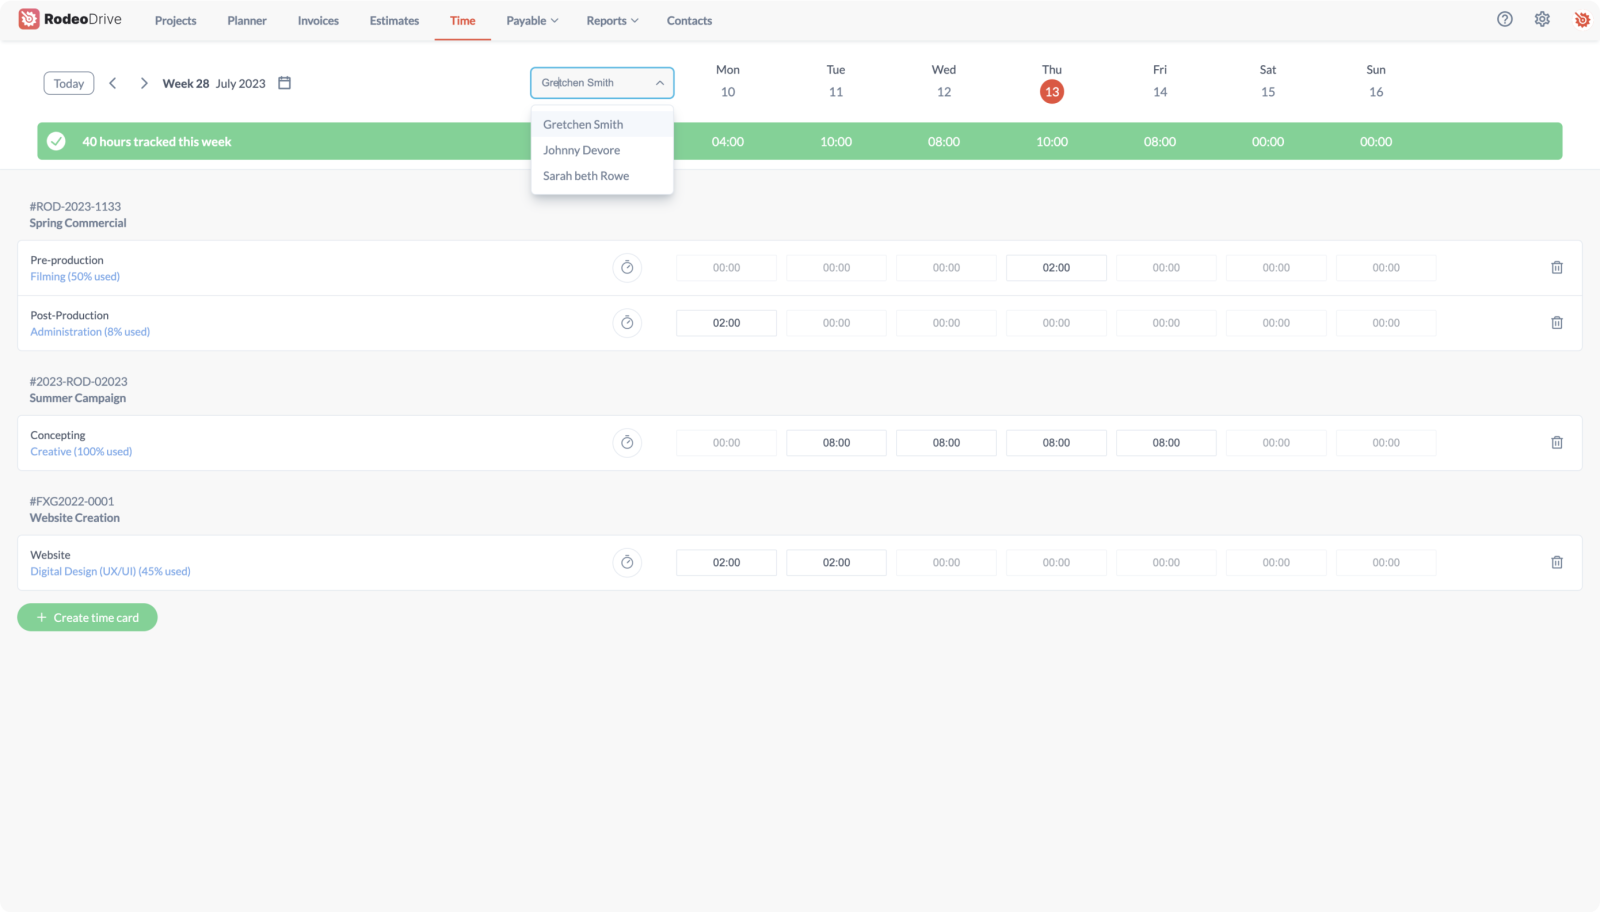
This means you’ll always have an accurate understanding of your actual costs and you can make immediate adjustments if necessary.
3. Billable utilization
Your team’s billable utilization is a marker of how much of their time is being spent on project activities that the client pays for, versus the amount of time they spend on non-billable activities.
More billable time equals a larger invoice for the client. On the other hand, agencies pay employees for non-billable activities, which can quickly eat away at their bottom line. Examples of non-billable activities might include things that are more administrative in nature, such as internal meetings or development training.
Many teams might find that nearly all of their time spent on projects is considered billable. That said, certain circumstances — such as having to recruit and hire a new team member to help with a particular project — might be categorized as a non-billable project activity.
To calculate a project team’s billable utilization rate, divide the number of billable hours your team has recorded by the total number of hours spent on project work. Then multiply by 100.
4. Cost performance index
Your cost performance index is a measure of your project’s cost efficiency, providing a ratio of your planned budget amount to the amount you’ve spent to accomplish your project tasks.
To calculate your cost performance index, simply divide your earned value by your actual costs. Use cost performance index KPIs to improve and optimize project cost estimation.
5. Percentage of tasks completed
Because tasks are perhaps the best way to break down your project into manageable pieces, your percentage of tasks completed is a good measure of your team’s progress.
Not only this, but it’s also a rather simple metric to track, as it can be broken down by project phase or team member to measure progress on a smaller scale.
If you find that task management is a challenge within your team. Check out these strategies for prioritizing tasks when everything is urgent.
6. Estimate at completion
Also known as EAC, Estimate at Completion is a method project managers use for forecasting budget costs while the project is already underway.
The EAC metric includes the amount of time invested by your team up to the point of measurement, as well as the remaining costs expected to be incurred to complete the project. There are a few different formulas you can use to calculate EAC, which you can find in this EAC in the project management guide.
This method of estimating allows project managers to account for unexpected obstacles or events, which makes EAC more accurate than estimates made during the planning stage.
7. Employee churn rate
Short-term projects are unlikely to deal with problems stemming from employee churn, so long as your organization isn’t facing issues that would cause employees to leave.
But for long-term projects, such as those with timelines of a year or more, employee churn might be a roadblock that can result in missed deadlines and overspending.
Because a high churn rate might cause low client satisfaction on a project, this is a KPI you may want to consider measuring.
This project KPI can be determined by dividing the number of employees who have left the company by the number of people on your initial project team, then multiplying by 100.
If your organization is in fact suffering from a high employee churn rate, it’s worth asking why this is the case. Can something be done to improve job satisfaction or accountability and keep team members around for longer? This is likely a conversation upper management will need to partake in as well.
Related: 13 Best Practices for Successful Change Management

8. Resource capacity
In simple terms, your resource capacity is the number of work hours your team has available to dedicate to the project. This is an important metric to monitor in organizations where employees are staffed on several projects at once.
To calculate resource capacity for a team member, just multiply their total number of available work hours per day by the number of workdays they’ve allocated to the project.
During your organization’s busy season, a low resource capacity might result in missed deadlines and milestones, which is why this is a useful metric to monitor throughout the project.
Some project management tools, such as Rodeo Drive, make it easy to monitor your team’s resource capacity, as they provide a visual representation of everyone’s workload. This way, you can see what’s on everyone’s plate for the week before assigning them additional tasks.
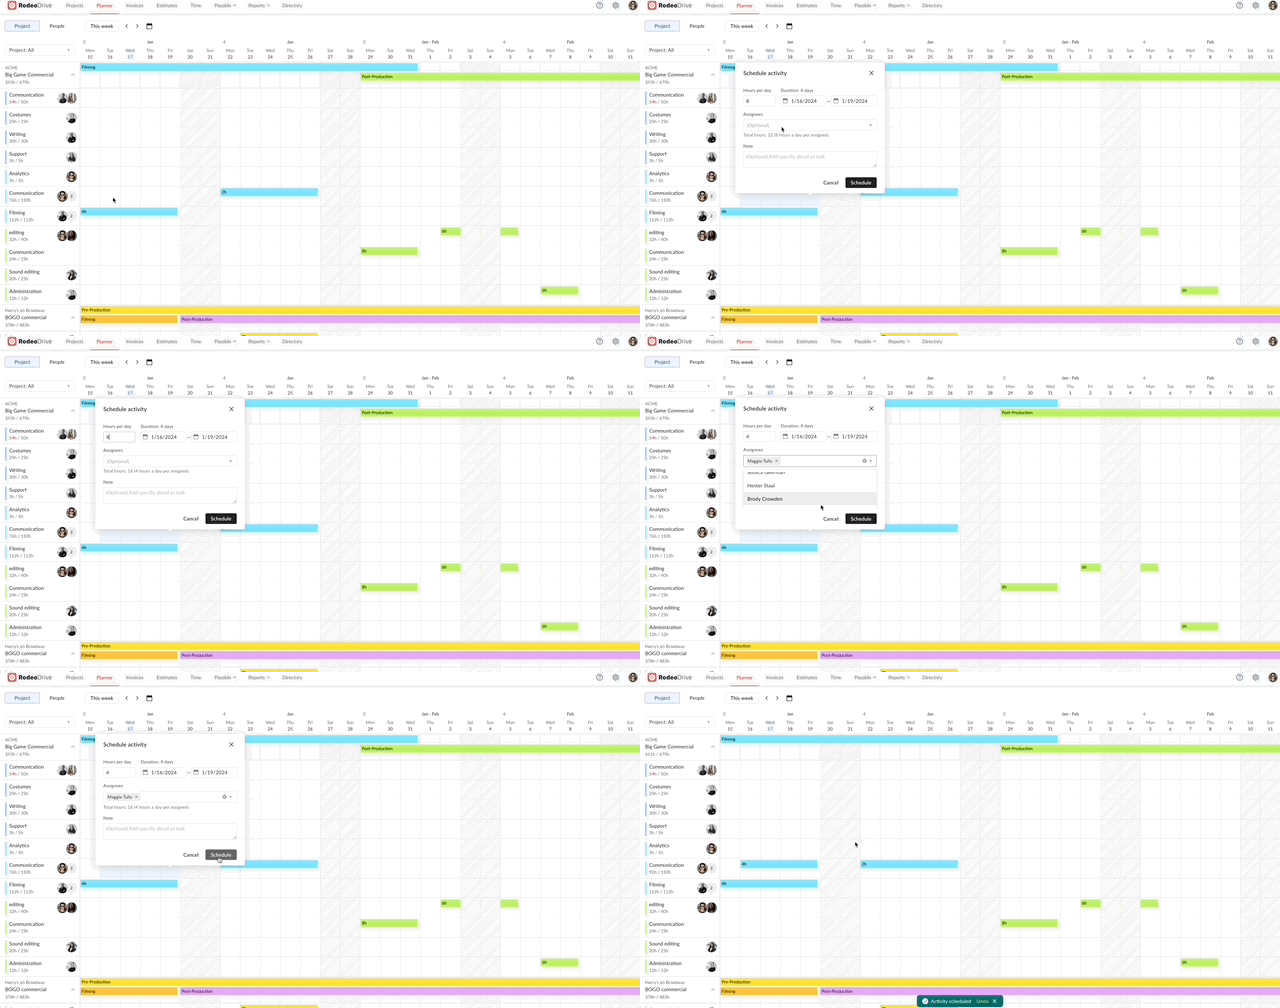
Plus, your team can add their own project work schedule in Rodeo Drive, which makes it easier for project managers to gauge resource capacity without having to use a formula.
Related: What Is Project Resource Management? A Complete Guide for 2024
9. Schedule variance
Schedule variance is calculated by subtracting planned value from earned value. If your schedule variance is negative, that means your project is behind schedule, as you haven’t earned as much as your project plans say you should’ve at that point in the project.
It’s also important to note that although schedule variance indicates whether your project is progressing on time, this KPI is measured in monetary units rather than units of time.
10. Number of budget iterations
This KPI indicates the number of times your budget was revised before it gained final approval.
While this isn’t a number that you’ll likely revisit after the planning stage, it might be indicative of the amount of time the project manager spent on strategic planning, as well as how carefully the budget was examined before it was approved.
Both of these factors might make a budget more likely to succeed. A budget that was quickly approved without much consideration for accuracy might be doomed from the start.
Implementing this KPI can help improve the budget proposal development and approval process.
11. Average cost per hour
This might be considered a lagging KPI, but it’s a helpful indicator of how well funding resources were allocated toward project activities.
In essence, the average cost per hour is just the sum of all costs involved in the completion of your project. Everything should be factored into this cost calculation, including salaries, benefits, and materials.
If your average cost per hour is significantly higher than the value of what the project produced, that’s an important learning you can take with you into future projects.
12. On-time completion percentage
On-time completion percentage is a KPI often used by agencies to determine whether project managers are meeting expectations with regard to project deadlines.
The formula for this percentage involves dividing the number of projects completed on time by the total number of projects for the same period. Then multiply by 100.
You could also modify this formula to examine the on-time completion percentage of tasks within a project. When evaluating a team member’s performance, knowing the percentage of tasks they finished by the deadline might be a useful data point to gauge their time management skills.
Takeaway
There you have it. Hopefully, we’ve left you with a robust understanding of Key Performance Indicators and a better idea of which KPIs to implement in your own processes.
If you’re looking for a project management tool to help automate some of these measuring and monitoring tasks, don’t forget to check out Rodeo Drive.
Rodeo Drive is a software solution that’s specifically designed to meet the needs of creative teams, with features like budgeting, task planning, time tracking, reporting, and invoicing all available in a single app.
Want to give it a shot? Try for free today.


